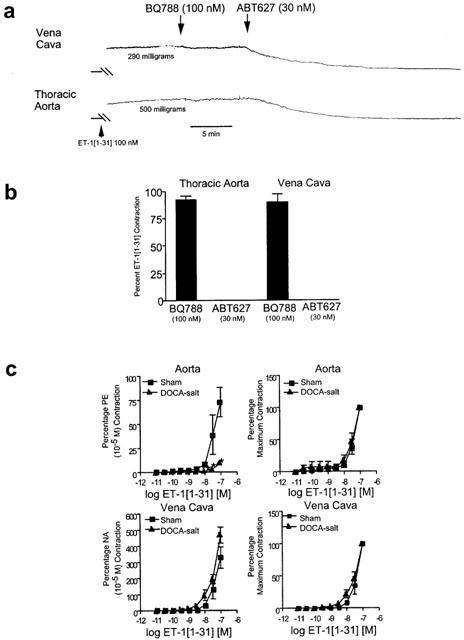
Figure 3.

(a) Tracing of vena cava and aortic response to ET-1(1–31) in the presence of the ETB receptor antagonist BQ788 (100 nM) or ETA receptor antagonist ABT-627 (30 nM). (b) Quantitation of effect of receptor antagonists on contraction induced by ET-1(1–31) (100 nM). Bars represent±s.e.mean for n=4–6 animals. (c) Effect of ET-1(1–31) on aorta and vena cava. Data are presented as means±s.e.mean and as a percentage of an initial phenylephrine (PE) or noradrenaline (NA) response (left) or as a percentage maximal response (right) for an n of six animals. *P<0.05, ANOVA repeated measures.
