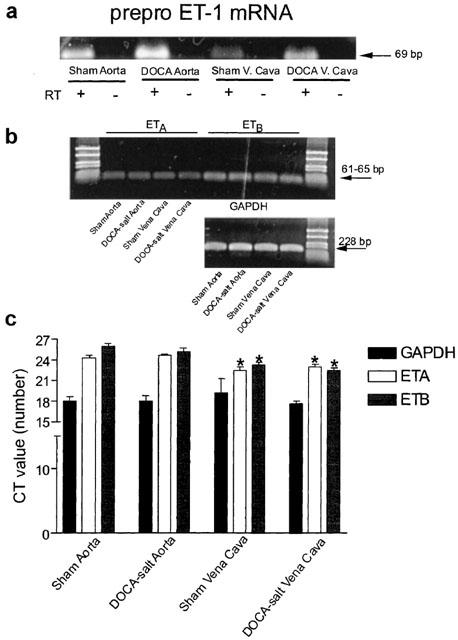
Figure 4.

(a) Final product of real time RT–PCR performed for prepro ET-1 (40 cycles, 200 nM primers). Half of the final PCR product was used for this gel (2% agarose). RT=reverse transcriptase. Representative of three separate isolations performed in duplicate. (b) Final product of real time RT–PCR performed for ETA, ETB and GAPDH mRNA in sham and DOCA-salt aorta and vena cava run on 2% agarose and stained with ethidium bromide (40 cycles, 200 nM primers). Half of the final PCR product was used for this gel. Representative of four separate isolations performed in duplicate. (c) Quantitation of CT values for GAPDH, ETA and ETB receptor mRNA in experimental broups. Bars represent±s.e.mean for n=4 performed in duplicate. *Indicates statistically significant differences (P <0.05) vs aortic comparison within experimental group.
