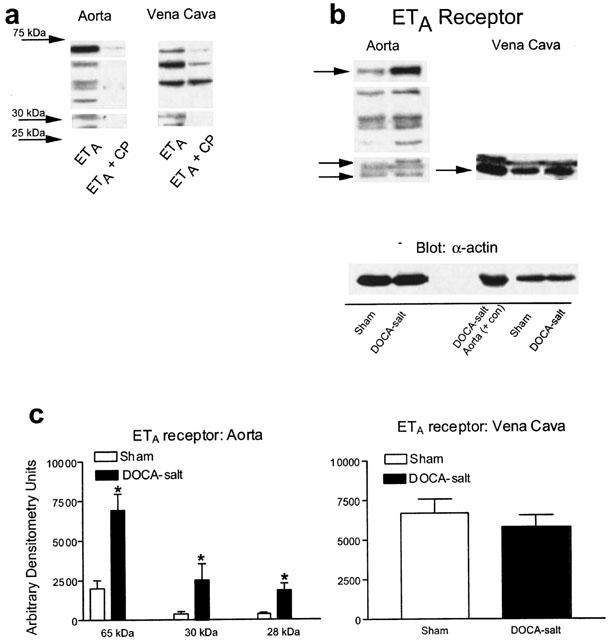
Figure 5.

(a) Visualized Western blot showing immunoreactive bands that drop out in the presence of a competing peptide for the ETA receptor. (b) Representative blots for the ETA receptor in aorta and vena cava of sham and DOCA-salt rats. (c) Densitometry results for ETA receptor immunoreactive bands in aorta and vena cava. Bars represent means±s.e.mean for seven to eight animals. *Indicates statistically significant differences (P<0.05) in sham vs DOCA-salt comparison.
