
Figure 4.
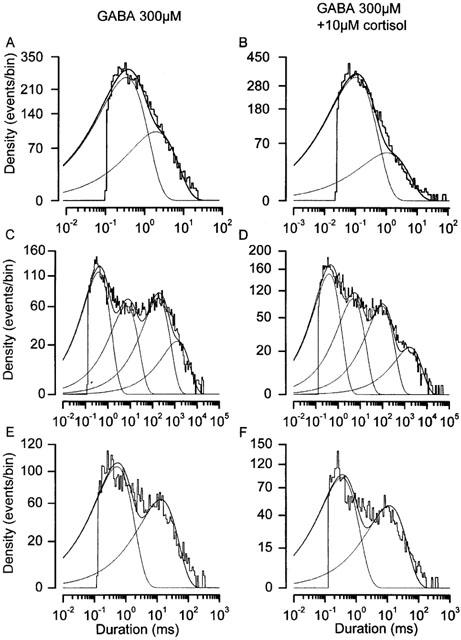
Parvocellular neurone GABAA channel dwell times unaffected by cortisol. Dwell time histograms for GABA channels recorded in the presence of 300 μM GABA (A, C & E) and 300 μM GABA +10 μM cortisol (B, D & F). Dwell times are log binned (see Methods) and event density is displayed on a square root scale. Under this transformation, individual time constants appear as density peaks. The histograms show the aggregate data for four patches analysed in the absence and four patches analysed in the presence of 10 μM cortisol. Mean data for fits to each individual patch are shown in Table 2. Solid lines show the combined fits and dotted lines show the individual components of each fit. Membrane holding potential −60 mV, 36°C, pipette solution V, bath solution IV (Table 1).