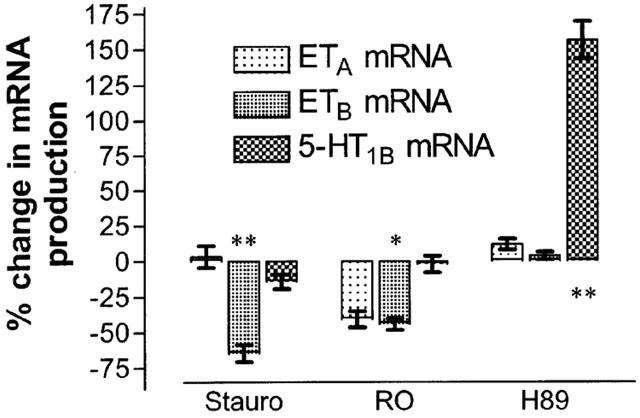
Figure 2.

Quantitative analysis with real-time PCR of the levels of receptor mRNA when co-culturing with inhibitors compared to the amount in cultured controls. The bars represent mean±s.e.mean of three separate measurements. Statistically significant changes are indicated with *P<0.05 and **P<0.01. The level of ETA receptor mRNA is not affected significantly through the inhibitors employed, the level of ETB receptor mRNA is significantly reduced when co-culturing with staurosporine and RO 31-7549, and the level of 5-HT1B receptor mRNA was greatly augmented when co-culturing with H 89. Results for mRNA for the 5-HT1D receptor are not displayed since the levels were below detection limit.
