Figure 1.

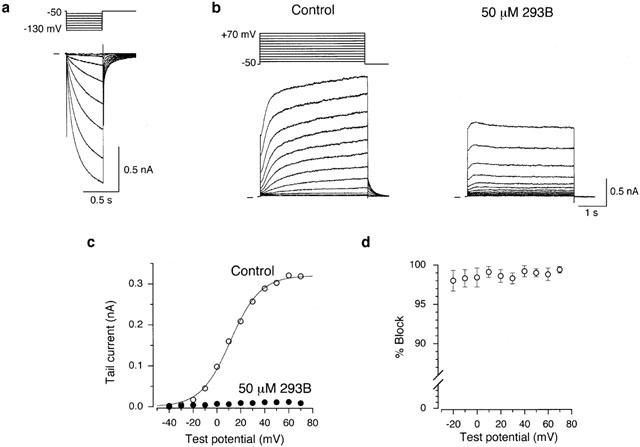
Block of IKs by 293B in an isolated guinea-pig SA node cell. (a) An SA node cell was hyperpolarized every 8 s from a holding potential of −50 mV to test potentials of −60 to −130 mV for 500 ms in 10 mV steps during superfusion with normal Tyrode solution. (b) A 4-s depolarizing test pulse was applied every 15 s from a holding potential of −50 mV to membrane potentials of −40 to +70 mV in 10 mV steps before (left-hand panel) and 3 min after exposure to 50 μM 293B (right-hand panel). These records were obtained from the cell shown in (a) but in the presence of 0.4 μM nisoldipine and 5 μM E-4031 to block ICa,L and IKr, respectively. A schematic diagram of the voltage-clamp protocol is given above the control traces. (c) I-V relationships for the tail currents measured upon return to a holding potential of −50 mV following 4-s depolarizing clamp pulses to various test potentials under control conditions and during exposure to 50 μM 293B, from the data shown in (b). A continuous curve through the control data represents the least-squares fit of a Boltzmann equation, yielding V1/2 of 11.4 mV and k of +12.6 mV. (d) Percentage block of IKs by 50 μM 293B measured in the tail currents elicited upon return to a holding potential of −50 mV following a 4 s depolarizing voltage step to various test potentials between −20 and +70 mV (n=6). IKs tail current at a test potential of −30 and −40 mV were too small (⩽10 pA) to accurately measure the reduction by 50 μM 293B.
