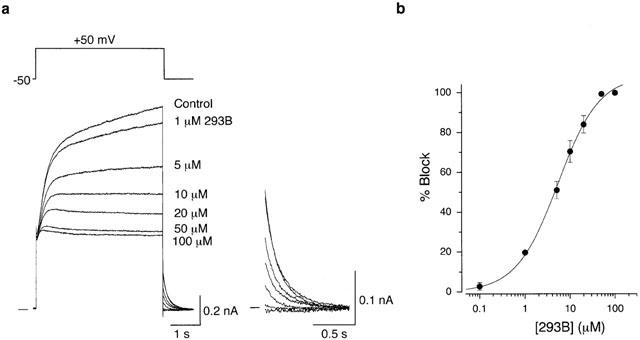
Figure 2.

Concentration-dependent block of IKs by 293B. (a) Superimposed current traces in response to a 4-s depolarizing voltage step to a test potential of +50 mV before (Control) and during exposure to 293B at a concentration of 1, 5, 10, 20, 50 and 100 μM in a same cell. The cell was exposed to each concentration of 293B for 2–3 min. All tail currents were illustrated on an expanded scale (inset). (b) Concentration-response relationship for the block of IKs tail current by 293B. Percentage block represents the fraction of IKs tail current at −50 mV reduced by 293B at each concentration with reference to the control amplitude of the tail current. The continuous curve was drawn by a least-squares fit of a Hill equation, yielding Imax of 100%, IC50 of 5.3 μM, and nH of 0.94 (see text). Data points represent mean±s.e.mean of six different cells.
