
Figure 2.
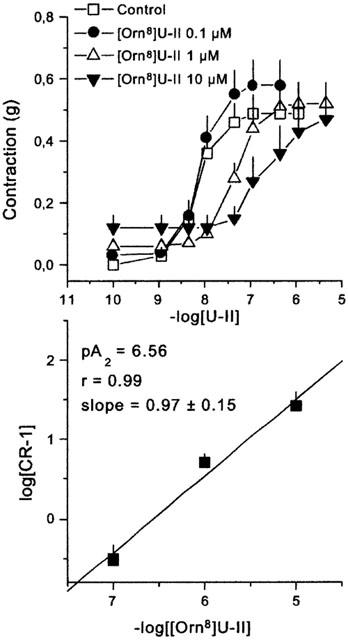
Concentration-response curves to human urotensin II (U-II) obtained in the absence (control) and in presence of increasing concentrations (0.1, 1, and 10 μM) of [Orn8]U-II. The bottom panel shows the corresponding Schild plot. Points indicate the means and vertical bars the s.e.mean of 6–8 separate experiments.