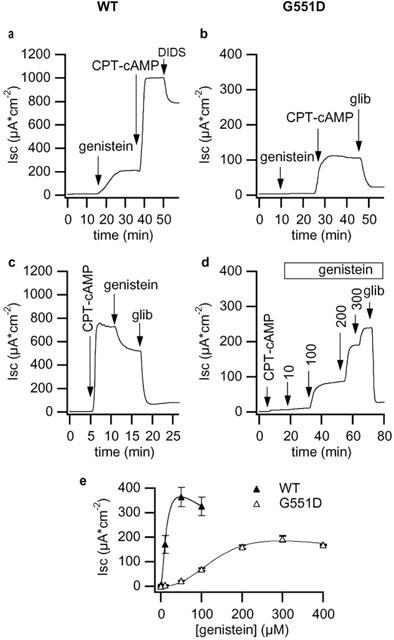
Figure 3.

Isc response to genistein. Representative traces depicting the response of wt-CFTR (a and c, clone N10) and of G551D-CFTR (b and d, clone 6E) permeabilized monolayers to apical application of genistein. If not otherwise stated, the concentration of genistein was 50 μM, and that of CPT–cAMP, glibenclamide and DIDS was 500 μM. (e) Dose-response relationship to genistein of wild type and G551D-CFTR epithelia after preactivation with 30 μM or 500 μM CPT–cAMP, respectively. Each point is the mean of four to seven different experiments and vertical bars are s.e.
