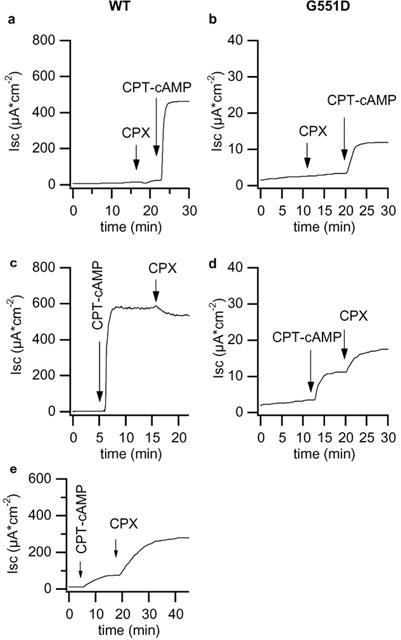
Figure 4.

Isc response to CPX. Traces depict the response of wt-CFTR (a and c, clone N8) and of G551D-CFTR (b and d, clone A1) permeabilized monolayers to apical addition of 100 μM CPX. The concentration of CPT–cAMP was 500 μM. In (e) the response of wild type monolayers to CPX after 30 μM CPT–cAMP.
