
Figure 5.
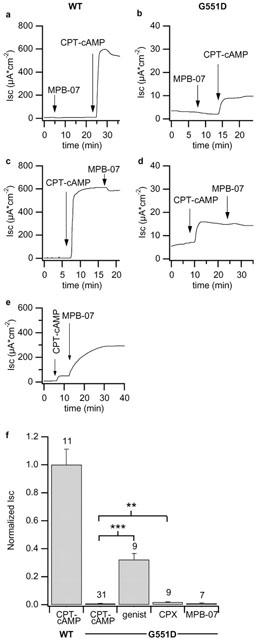
Isc response to MPB-07. Traces depict the response of wt-CFTR (a and c, clone N10) and of G551D-CFTR (b and d, clone 6E) permeabilized monolayers to apical application of 200 μM MPB-07. The concentration of CPT–cAMP was 500 μM. In (e) the response of wild type monolayers to MPB-07 after preactivation with 30 μM CPT–cAMP. The normalized response of FRT monolayers to the different CFTR activators is represented in (f). Mean of wt-CFTR epithelia were obtained pooling data from clones N8 and N10, and mean of G551D-CFTR epithelia were obtaining pooling data from clones 6E and A1. Above columns are the numbers of experiments in each condition. Vertical bars are SE. Asterisks indicate statistically different values (**P<0.0005, ***P<0.0001).