
Figure 2.
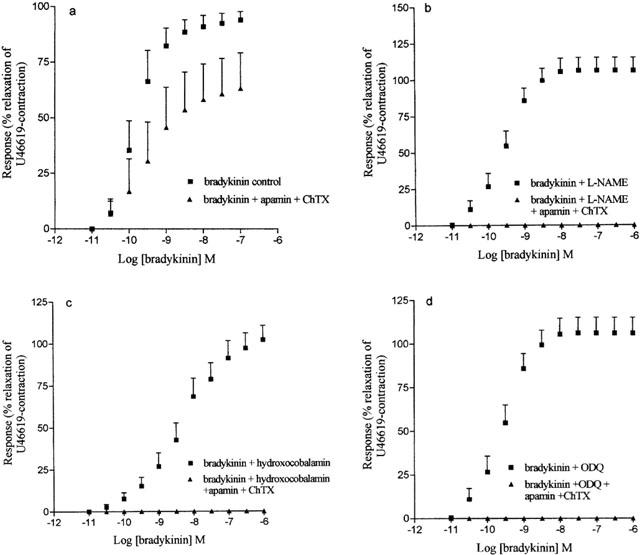
Concentration response curve to bradykinin in (a) control tissues (n=5) and in tissues treated with (b) L-NAME (100 μM, n=7) (c) hydroxocobalamin (200 μM, n=6) and (e) ODQ (10 μM, n=5) in the absence and presence of apamin (100 nM) and ChTX (100 nM). Data are expressed as mean±s.e.mean. The number of experiments (n) is shown in parenthesis.