
Figure 2.
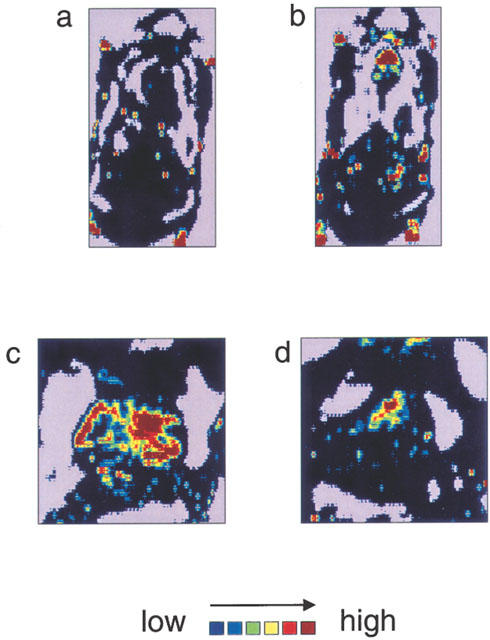
Increase in blood flow in sponge granulomas induced by bFGF treatment and inhibitory effect of BCEAB on this blood-flow increase. On day 7 after the sponge implantation, the local blood flow around the sponge granulomas was measured by the laser doppler perfusion imager. The scanned data are shown by the colour-coded image, which indicates blood flow in the whole back of hamsters treated with saline (a) or bFGF (0.3 μg site−1 day−1) (b). The areas circled with dotted lines indicate the sites of sponge implantation. Panels (c) and (d) show the local blood flow around the sponge implantations, which were treated with bFGF alone (c) or bFGF plus BCEAB (5 nmol site−1 day−1) (d).