
Figure 3.
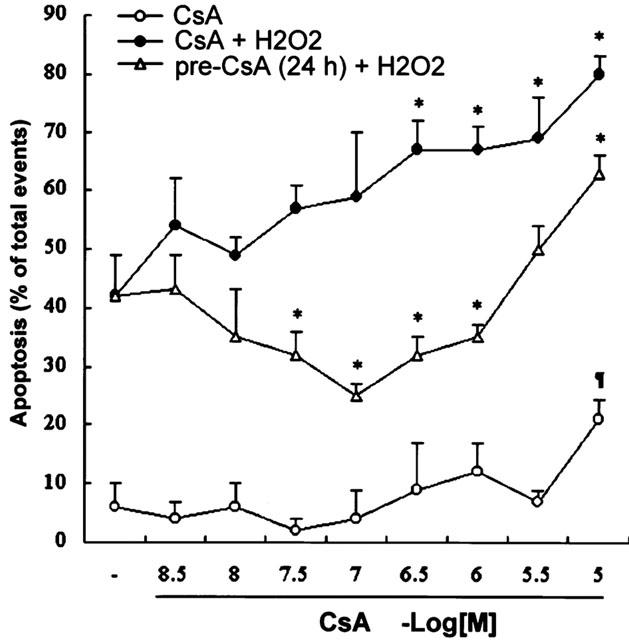
Flow cytometric analysis quantification of apoptosis in H9c2 cardiac myocytes exposed to different concentrations of CsA for 24 h, CsA combined with 100 μM H2O2 for 24 h, or pre-treated with CsA for 24 h before 100 μM H2O2 treatment for another 24 h. Cells were examined for cell apoptosis with the annexin-V/PI staining technique as described in Materials and methods. Data are expressed as mean±s.e.mean (n = 5). *P<0.05, as compared to the cells treated with 100 μM H2O2; ¶P<0.05, as compared to the untreated cells.