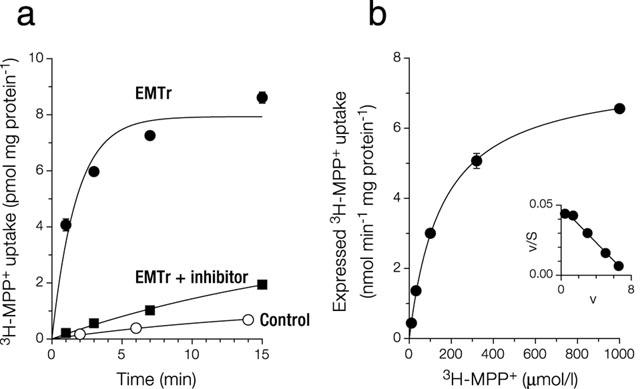
Figure 1.

Characterization of 293 cells expressing EMTr in Na+ buffer. (a) Time course of MPP+ uptake. Cells grown in dishes were incubated at 37°C with 0.1 μmol l−1 MPP+. Shown is mean±s.e.mean (n=3). Shown are control cells (stably transfected with vector pcDNA3, kin=0.74±0.07 μl min−1 mg protein−1, kout=0.06±0.01 min−1), EmTr cells (see main text for kinetic constants) and EMTr cells in the presence of 10 μmol l−1 disprocynium24 (also during preincubation; kin=1.8±0.2 μl min−1 mg protein−1, kout=0.05±0.02 min−1). (b) Saturation of expressed uptake of MPP+. An uptake period of 1 min was chosen to approximate initial rates of transport. Shown is mean±s.e.mean (n=3). Expressed uptake was calculated by subtraction from total uptake of uptake into cells transfected with vector pcDNA3 alone. This control uptake increased linearly with MPP+ concentration, slope=0.66 μl min−1 mg protein−1. The graph shown was obtained by fitting v=Vmax * S / (Km+S) by non-linear regression, with v: uptake velocity, and S: substrate concentration. Inset: Eadie-Hofstee transformation. With our model of activation (see Figure 9), the corresponding equation is v=Vmax * S * (1+g * S/Kd ) / (Km+S * (1+S/Kd )). After fitting by non-linear regression, the graph coincides with the one shown.
