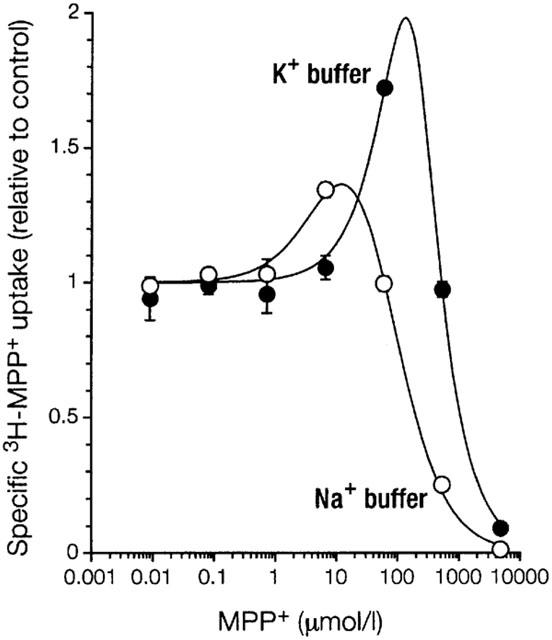
Figure 8.

Comparison of activation of MPP+ uptake in standard buffer (Na+ buffer) or K+ buffer. Shown as a function of inhibitor concentration is mean±s.e.mean (n=3) of specific uptake of 3H-MPP+ (1 nmol l−1) relative to control into 293 cells expressing EMTr. For both conditions, cells were preincubated in the respective buffers for 24 min without inhibitor. For further details see legend to Figure 2.
