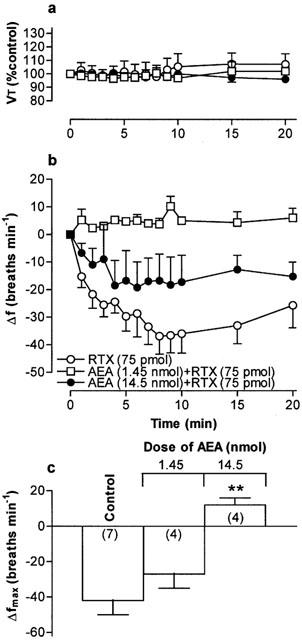
Figure 7.

(a) Tidal volume (VT) and (b) respiratory frequency (f) in rats following an initial microinjection of resiniferatoxin (RTX, 75 pmol) and 60 min after microinjection of increasing doses of arachidonyl ethanolamide (AEA) into the commissural nucleus of the solitary tract (cNTS) or urethane-anaesthetized, spontaneously breathing rats. VT data are expressed as a percentage of the pre-injection control value and frequency data as change from pre-injection control value. (c) Maximum change in respiratory frequency (Δfmax) induced by microinjection of 75 pmol RTX (Control) and 60 min after injection of increasing doses of AEA into the cNTS. Data are the mean of 3–7 animals (individual n values are shown in parentheses) and vertical bars represent s.e.mean. **P<0.01, significantly different from the control response (ANOVA followed by Dunnett's test).
