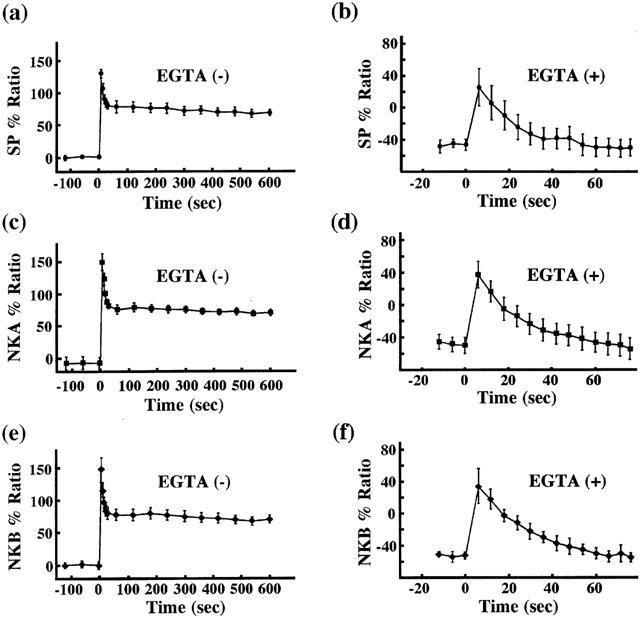
Figure 5.

Summary of the effects of tachykinins on the [Ca2+]i in the presence or absence of extracellular Ca2+. All measurements were performed as shown in Figure 4 in normal PSS or in Ca2+-free PSS containing 0.3 mM EGTA. The time course of the change in [Ca2+]i induced by tachykinins in the absence or presence of EGTA was presented. As shown in Figure 4, the levels of [Ca2+]i at rest and phenylephrine-induced sustained contraction were designated as 0 and 100%, respectively. Data are the mean±s.e.mean (n=5–6).
