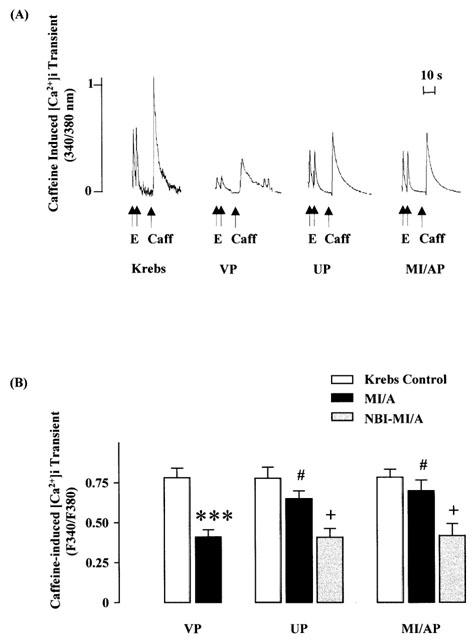
Figure 5.

Effects of UP or MI/AP on the amplitude of caffeine-induced [Ca2+]i transient in single ventricular myocytes subjected to prolonged MI/A with or without the presence of nor-BNI. Severe MI/A was induced by 10 mM Na2S2O4+10 mM 2-DOG in glucose-free Krebs solution for 9 min. (A) Representative tracings. (B) Group results of the fluorescence signal values. Values are mean±s.e.mean. n=10 myocytes in VP group, and n=9 in MI/AP, n=11 in UP, n=6 cells in NBI-MI/AP and n=7 in NBI-UP groups. The cells were obtained from 6–7 rats for each group. E=electrical stimulation; Caff=caffeine. ***P<0.001 vs Krebs control value in the same group; #P<0.05 vs corresponding value in VP group, +P<0.05 vs the corresponding value without nor-BNI within the group.
