
Figure 3.
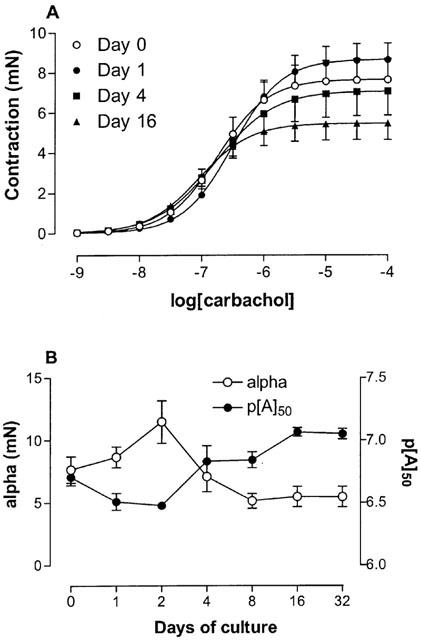
Carbachol induced contraction. (A) Concentration-effect curves to carbachol obtained on fresh and cultured mouse tracheal segments. Tissues were cultured for 1, 2, 4, 8, 16 and 32 days, although data only relating to segments cultured for 0, 1, 4, and 16 days are shown for clarity. (B) Compiled data for the maximum effect (alpha) and the potency (p[A]50) for all the different days of culture. *P<0.05 between cultured and fresh segments. Each point represents the mean of all segments tested with error bars representing s.e.mean (n=6–8).