
Figure 8.
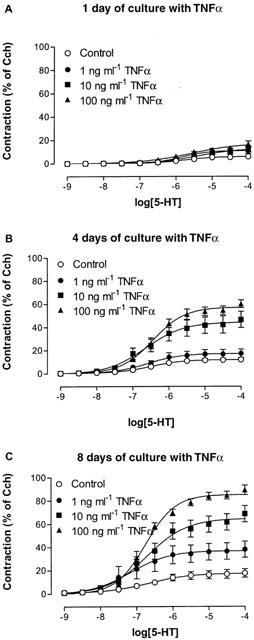
Concentration-effect curves to 5-HT obtained on mouse tracheal segments, cultured for (A) 1, (B) 4 and (C) 8 days in absence and presence of 1, 10 or 100 ng ml−1 TNFα. Each point represents the mean of all segments tested with error bars representing s.e.mean from 6–8 animals.