
Figure 9.
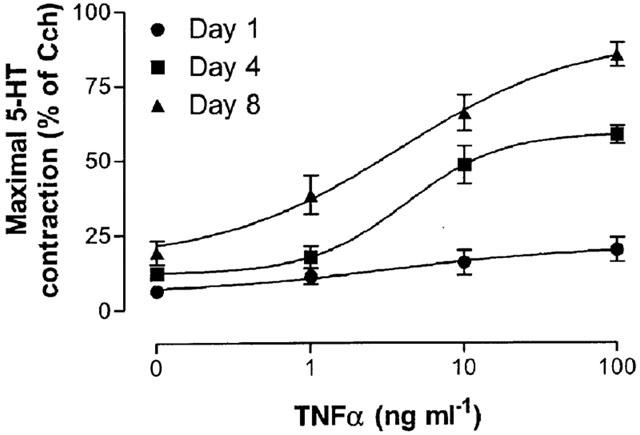
Concentration-effect curves of the maximal contraction to 5-HT induced by TNFα on mouse tracheal segments cultured for 1, 4 and 8 days. Each point represents the mean of all segments tested with error bars representing s.e.mean from 6–8 animals.