
Figure 1.
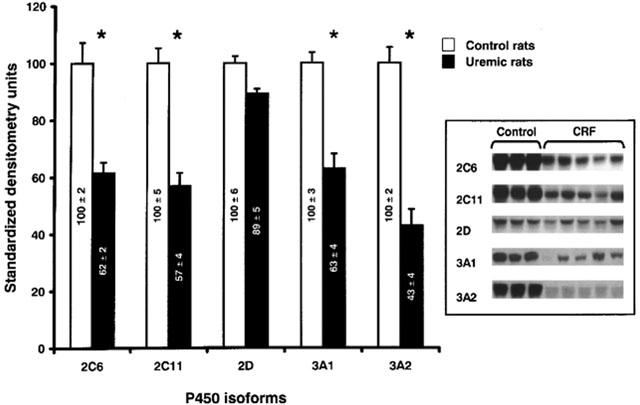
Protein expression of hepatic cytochrome P450 isoforms in hepatocytes incubated with serum from control and CRF rats. Protein bands are expressed in densitometry units (%). The densitometry units of control rats were arbitrarily defined as 100%. Data are the mean±s.e.mean of eight experiments in each group. *P<0.01 as compared to serum from control. Representative blots are also shown.