
Figure 2.
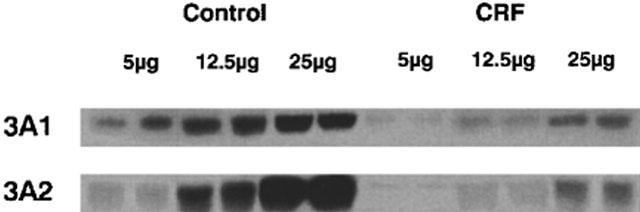
Protein expression of hepatic cytochrome P450 3A1 and 3A2 in hepatocytes incubated with serum from control and CRF rats. Three protein loadings have been used: 5, 12.5 and 25 μg. The difference in protein expression of CYP3A1 and 3A2 between control and CRF was the same for each protein loading.