
Figure 3.
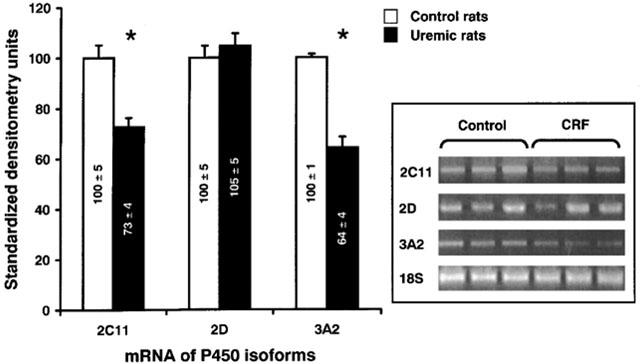
mRNA encoding hepatic cytochrome P450 isoforms (CYP2C11, CYP2D and 3A2) in hepatocytes incubated with serum from control and CRF rats. mRNA bands are expressed in standardized densitometry units (%). The densitometry values for cytochrome P450 isoforms were standardized by dividing these values by the values for 18S ribosomal RNA. The standardized densitometry units of control rats were arbitrarily defined as 100%. Data are the mean±s.e.mean of eight experiments in each group. *P<0.005 as compared to serum from control rats. Representative blots are also shown.