
Figure 6.
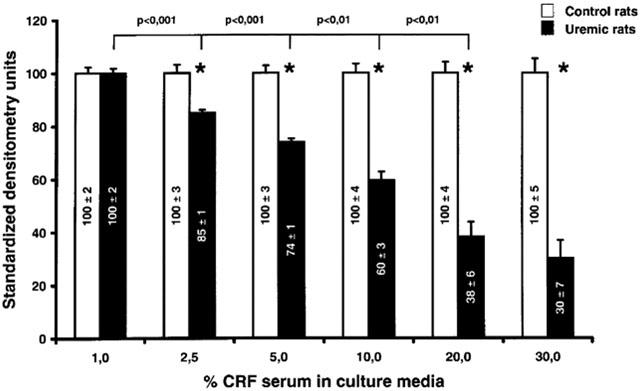
Level of CYP3A2 expression as a function of the concentration of serum used for the incubation of hepatocytes. Hepatocytes were incubated for 24 h with progressive concentration of serum from control and CRF rats. Protein bands are expressed in densitometry units (%). The densitometry units of control rats were arbitrarily defined as 100%. Data are the mean±s.e.mean of six experiments. *P<0.01 as compared to serum from control rats.