Figure 3.

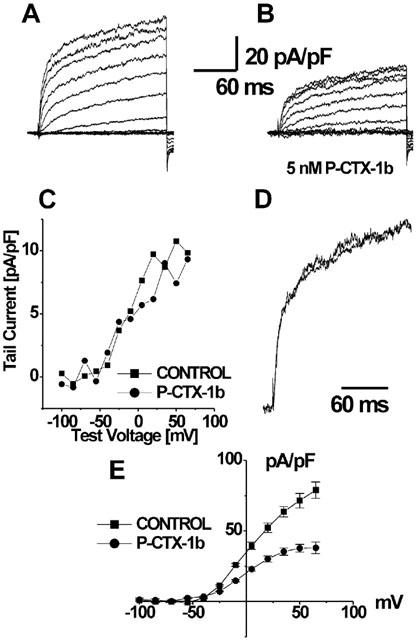
Effect of P-CTX-1b on potassium currents under whole-cell patch–clamp conditions. Panels a and b show the respective current traces before (a), and after addition of 5 nM P-CTX-1b to the external medium (b). The current has been normalized by the capacitance of the cell (46.7 pF) and 65% of the series resistance (12 MΩ) was compensated. Panel c depicts the averaged current amplitude of the last five points at the end of the recording, which corresponds to the recovery phase of the tail current at −90 mV. Panel d shows the superimposed traces at +35 mV, normalized with respect to their respective maximum values. The same result was obtained for all the traces; it is apparent that in these conditions, no major changes in the activation kinetics were present. Panel e shows the I–V relationship of the average current obtained from the last 5.8 ms of the test-pulse, before and after P-CTX-1b addition, each value is the mean±s.e.mean of data from four determinations. Notice that the blockade of K+ current is more pronounced at stronger membrane depolarization.
