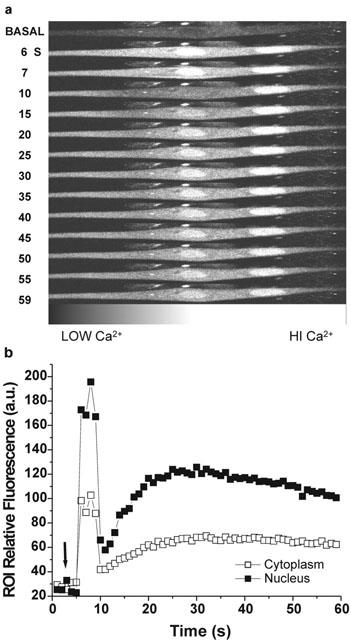
Figure 5.

Fast and slow Ca2+ signals evoked by P-CTX-1b in a rat myotube loaded with the calcium indicator fluo-3. Selected series of fluorescence images (in grayscale) captured by confocal laser scanning microscopy before (basal), and at the times indicated after the addition of 10 nM P-CTX-1b to the medium (a). Time-course of the relative fluorescence changes for two regions of interest (25 by 25 pixels) one located in the nucleus and the other in the cytoplasm (b). The arrow indicates the moment at which P-CTX-1b was added to the bathing medium. Note that after the addition of P-CTX-1b there is a persistent increase in fluorescence at the nuclear region to values higher than those found at the cytosol. Note also that the fluorescence in the left nucleus oscillated after the first few seconds of toxin action.
