
Figure 4.
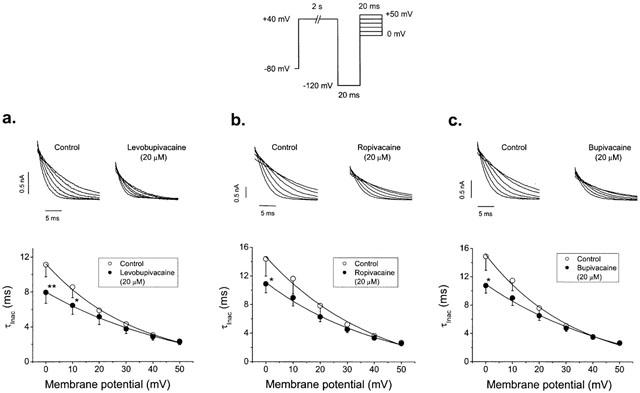
Effects of 20 μM levobupivacaine (a), ropivacaine (b) and bupivacaine (c) on the inactivation kinetics of HERG. Current records were obtained by using the protocol shown in the top of the figure. Top panels show current records of test pulses obtained in the absence and in the presence of 20 μM of each drug. Bottom panels show plots of the time constant of inactivation at different membrane potentials in the absence and in the presence of each drug. Each point represents the mean±s.e.mean of 4–5 experiments. *P<0.05 vs control conditions.