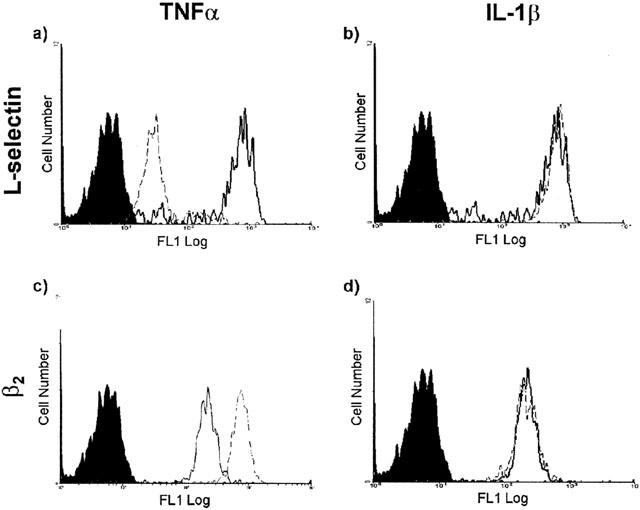
Figure 2.

Effect of TNFα and IL-1β on expression of L-selectin and β2 integrin on mouse neutrophils. Figure shows representative fluorescence histograms comparing cell surface expressions of L-selectin and β2 integrins on unstimulated and cytokine stimulated mouse neutrophils. Briefly, blood samples were collected by cardiac puncture and stimulated with the cytokines (both at 100 ng ml−1) at room temperature for 20 min prior to labelling with isotype-matched control mAbs or mAbs directed against L-selection (a/TNFα and b/IL-1β) and β2 (c/TNFα and d/IL-1β), followed by incubation with a FITC-conjugated F(ab′)2 mAb. Samples were analysed by flow cytometry as described in Methods. The filled tracings are from blood samples incubated with an isotype-matched control mAb, solid lines represent unstimulated cells and dashed lines represent stimulated cells. The histograms represent the cell number relating to the expression of the molecule examined and are representative of four separate experiments.
