
Figure 3.
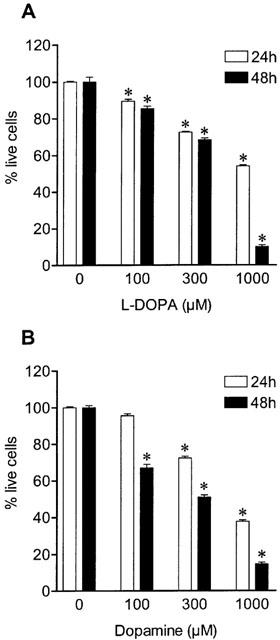
Concentration dependent effect of (A) L-DOPA and (B) dopamine on cell viability for 24 and 48 h. Each column represents the mean of 6–18 experiments per group; vertical lines show s.e.mean. *P<0.05 compared with control.
Official websites use .gov
A
.gov website belongs to an official
government organization in the United States.
Secure .gov websites use HTTPS
A lock (
) or https:// means you've safely
connected to the .gov website. Share sensitive
information only on official, secure websites.
Concentration dependent effect of (A) L-DOPA and (B) dopamine on cell viability for 24 and 48 h. Each column represents the mean of 6–18 experiments per group; vertical lines show s.e.mean. *P<0.05 compared with control.