
Figure 6.
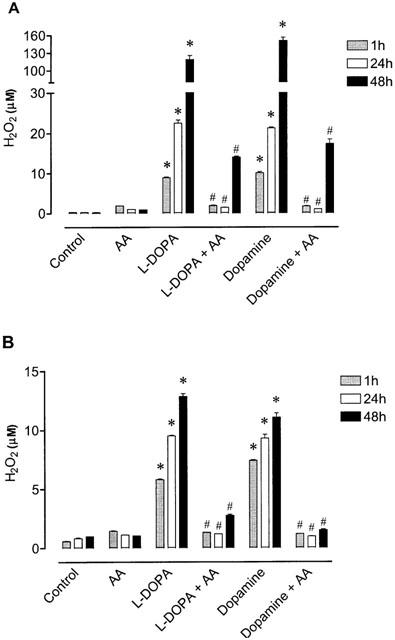
Levels of H2O2 in the absence and in the presence of ascorbic acid (AA, 200 μM) during (A) autoxidation working solutions of 1 mM L-DOPA or 1 mM dopamine and (B) extracellular medium during treatment with 1 mM L-DOPA or 1 mM dopamine. Each column represents the mean of 3–6 experiments per group and vertical lines show s.e.mean. *P<0.05 compared with control; and #P<0.05 compared with L-DOPA alone or DA alone.