
Figure 7.
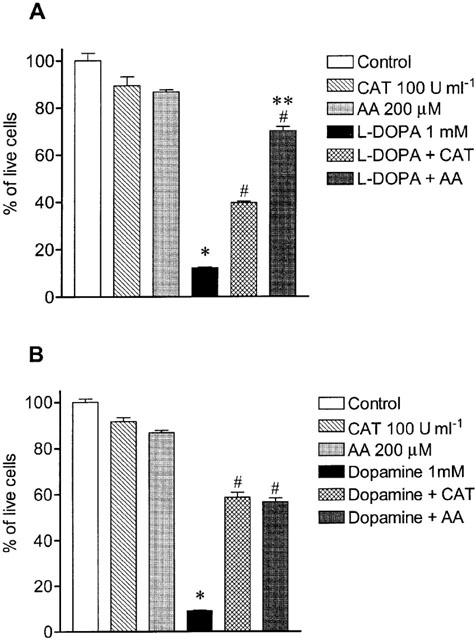
Effect of catalase (CAT, 100 U ml−1) and ascorbic acid (AA, 200 μM) on cell death induced by (A) 1 mM L-DOPA and (B) 1 mM dopamine. Each column represents the mean of 6–11 experiments per group and vertical lines show s.e.mean. *P<0.05 compared with control; #P<0.05 compared with L-DOPA alone or DA alone; and **P<0.05 compared with L-DOPA+CAT.