
Figure 8.
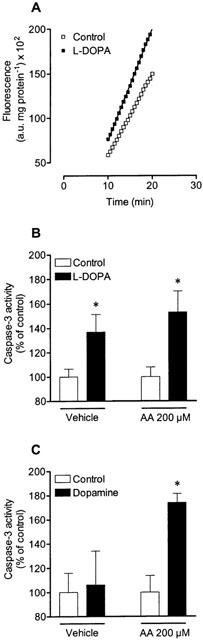
Fluorescence of specific caspase-3 substrate cleavage after treatment (9 h) with drugs. (A) represents the linear phase, used for determination of caspase-3 activity, of caspase-3 substrate cleavage in vehicle- and L-DOPA-treated cells. Effect of (B) 1 mM L-DOPA and (C) 1 mM dopamine in absence or in presence of 200 μM ascorbic acid (AA) on caspase-3 activity. Each symbol or column represents the mean of three experiments per group and vertical lines show s.e.mean. *P<0.05 compared with control.