
Figure 6.
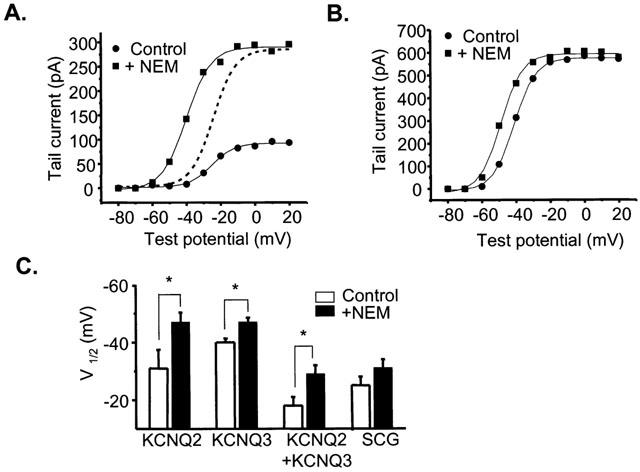
NEM-induces a hyperpolarizing shift in the V1/2 of activation of KCNQ channels. (A) Activation curve for tsA cells expressing KCNQ2 subunits before and after application of NEM. Voltage steps range from −80 mV to +40 mV in 10 mV increments. The tail current potential was −70 mV. The data were fitted by Boltzmann equations (solid lines) of the form Itail=Imax/(1+exp(V1/2-V)/k), where Itail is the fitted tail current amplitude, Imax is the maximum current, V1/2 is the voltage at which the conductance is half-activated, and k is the slope factor. The dotted curve is the fitted Boltzmann relation of the control data, scaled up so that the Imax is equal to that of the post-NEM curve. (B) Activation curve for tsA cells expressing KCNQ3 subunits before and after the application of NEM. Voltage steps range from −80 mV to +40 mV in 10 mV increments. The tail current potential was −70 mV. These data were also fitted by Boltzmann equations (solid lines) (C) Mean V1/2 of various KCNQ expressing cells as well as SCG neurons both before (open) and after NEM (filled) (*significant difference, Student's paired t-test, P⩽0.05).