
Figure 7.
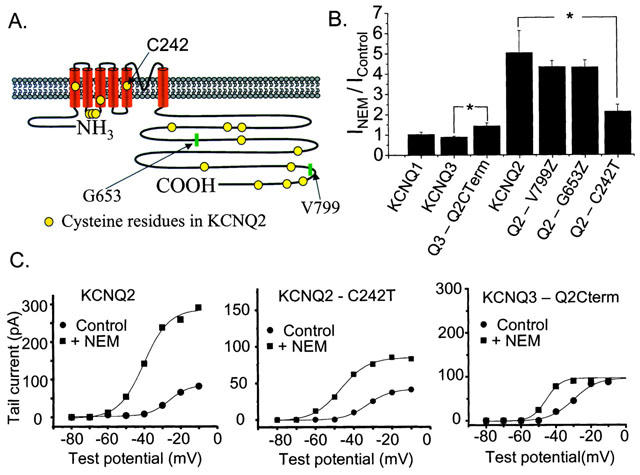
Investigation of possible regions on KCNQ2 responsible for NEM action. (A) Diagram of the location of cysteine residues on the KCNQ2 subunit. (B) Mean NEM-induced augmentation of current amplitudes for homomeric channels made up of the construct indicated below the column (*represents significant difference, Student's t-test, P⩽0.05). (C) Activation curves for tsA cells expressing KCNQ2 (left), KCNQ2-C242T (middle), or the KCNQ3/2 chimera (right) before and after the application of NEM. Voltage steps range from −80 mV to 0 mV in 10 mV increments. The tail current potential was −70 mV.