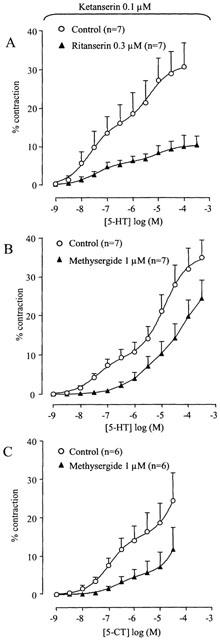
Figure 6.

Effect of ritanserin (A) on the 5-HT-induced concentration–contraction curve and of methysergide (1 μM) on the 5-HT- (B) and 5-CT- (C) induced concentration–contraction curve of porcine proximal stomach longitudinal muscle strips. The experiments were performed in the presence of ketanserin (0.1 μM). The curves shown superimposed on the vertically averaged data points±s.e.means represent simulations using the double Hill equation. The 5-HT-induced concentration–contraction curve in the presence of methysergide was not fitted, the vertically averaged experimental data points±s.e.means were connected by a line.
