
Figure 1.
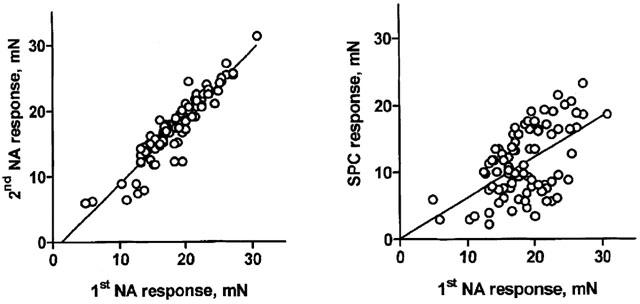
Maximum contraction response to NA and SPC relative to the first NA effect within the same preparation (n=83 vessels each). The linear regression slopes were 1.02±0.04 and 0.61±0.10, respectively, and the r2 was 0.87 and 0.31, respectively, yielding P-values of <0.0001 in both cases.