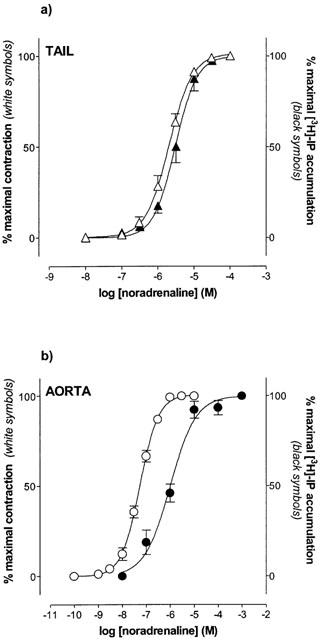
Figure 1.

Comparative analysis of concentration-response curves of contraction and [3H]-inositol phosphate accumulation to noradrenaline in tail artery (a) and aorta (b). Data are means (expressed as a percentage of the maximal response to the agonist)±s.e.mean of 5–6 experiments.
