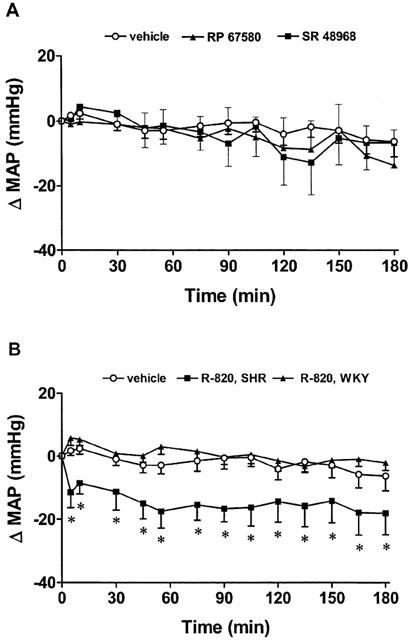
Figure 5.

Time-course effects on changes in mean arterial pressure (Δ MAP) induced by SN microinjection of (A) vehicle (aCSF with 10% DMSO, n=6), RP 67580 (500 pmol, n=5) and SR 48968 (500 pmol, n=6) in SHR, and (B) vehicle (aCSF with 10% DMSO, n=12) and R-820 (500 pmol) in SHR (n=12) and WKY (n=10). Each point represents the mean±s.e.mean of (n) rats. Comparison to vehicle values is indicated by *P<0.05.
