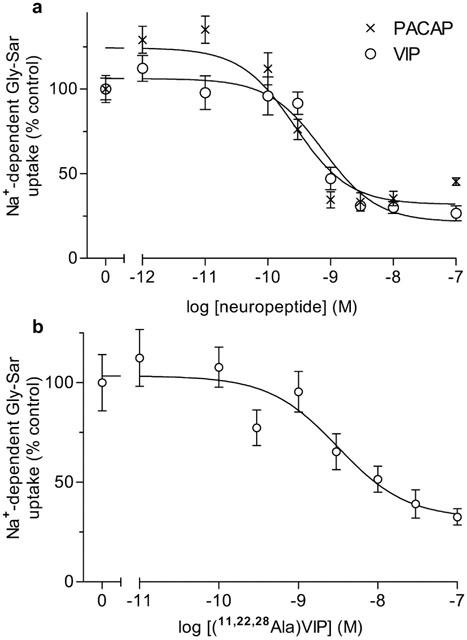
Figure 2.

Concentration-response curves for the effect of the neuropeptides PACAP and VIP, and the VPAC1-receptor selective agonist [11,22,28Ala]-VIP on Na+-dependent Gly-Sar uptake. (a) Top panel: Gly-Sar (100 μM) uptake (15 min) was measured across the apical membrane of Caco-2 cell monolayers in the presence or absence of basolateral VIP (open circles) or PACAP (X) (both 10−7–10−12 M) in the presence of extracellular Na+. The results are expressed as the percentage uptake under control (in the absence of either VIP or PACAP) conditions (after subtraction of the uptake in Na+ free conditions). Best-fit concentration response curves were fitted using GraphPad Prism version 3.00 (r2= 0.996 for VIP; r2=0.994 for PACAP). Data are mean±s.e.mean (n=6–18). (b) Bottom panel: Gly-Sar (100 μM) uptake (15 min) was measured across the apical membrane of Caco-2 cell monolayers in the presence or absence of basolateral [11,22,28Ala]-VIP (10−7–10−11 M) in the presence of extracellular Na+. The results are expressed as the percentage uptake under control (in the absence of [11,22,28Ala]-VIP) conditions (after subtraction of the uptake in Na+ free conditions). The best-fit concentration response curve was fitted using GraphPad Prism version 3.00 (r2=0.912). Data are mean±s.e.mean (n=10–16).
