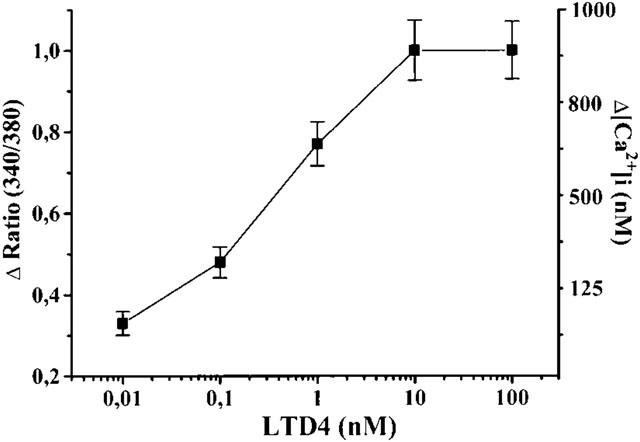
Figure 3.

Non-cumulative dose-response curve of LTD4 in isolated rat aortic smooth muscle cells. Each point is the means (±s.e.mean) of at least 60 cells obtained in five separate experiments. Left axis: fluorescent ratio (340/380); Right axis: [Ca2+]i (nM).
