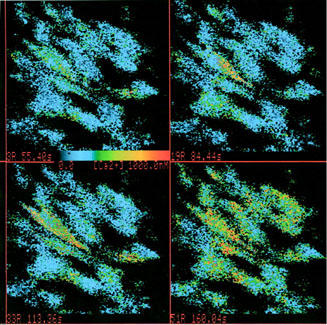
Figure 5.

Time sequence of [Ca2+]i in individual fura-2-loaded rat aortic smooth muscle cells in response to 10 nM LTD4 (representative experiment). Frames are described left to right and up to down. Frame 1 shows resting [Ca2+]i before the addition of LTD4. Frames 2, 3, 4 (29, 58 and 105 s after the addition of LTD4 respectively) illustrate the LTD4-induced [Ca2+]i increase. [Ca2+]i (nM) is colour-coded according to the calibration bar.
