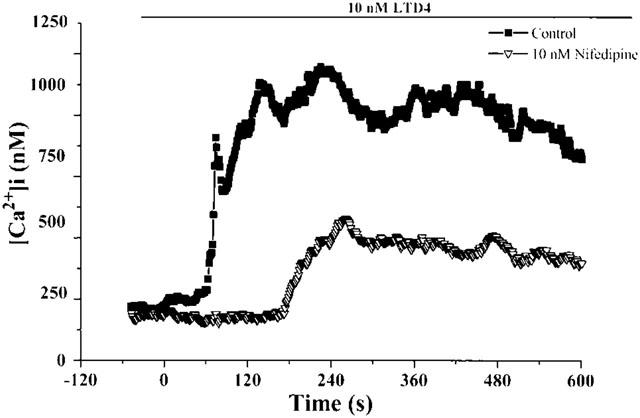
Figure 7.

Typical time-course of LTD4-induced [Ca2+]i increase in isolated rat aortic smooth muscle cells in control condition or after preincubation (10 min) with 10 nM nifedipine. LTD4 (10 nM) was administered at time=0 and maintained in the perfusion chamber until the end of experiment, as indicated. Curves are the mean of at least 12 cells. In each point, standard errors (s.e.mean) do not exceed 10% of values.
