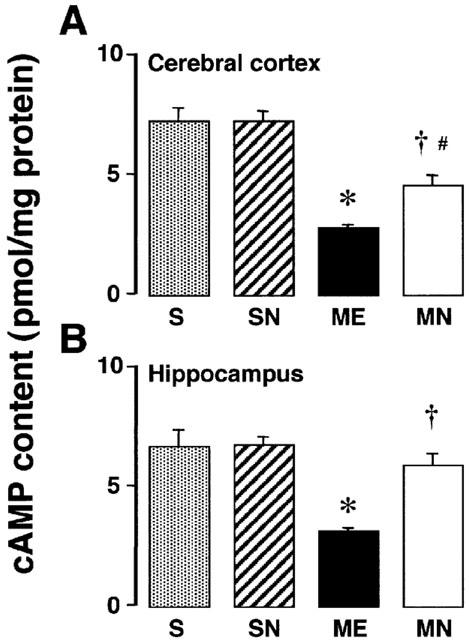
Figure 6.

cAMP content of the parietal cortex (A) and hippocampus (B) in the right hemisphere of the nefiracetam-untreated (ME) and nefiracetam-treated (MN) rats with ME, and of the nefiracetam-untreated (S) and nefiracetam-treated (SN) sham-operated rats on day 3 after the operation. Each value represents the mean±s.e.mean of six (S and SN) or eight (ME and MN) animals. *Significantly different from the sham-operated group (P<0.05). †Significantly different from the corresponding untreated ME group (P<0.05). #Significantly different from the nefiracetam-treated sham-operated (SN) group (P<0.05).
