Figure 7.

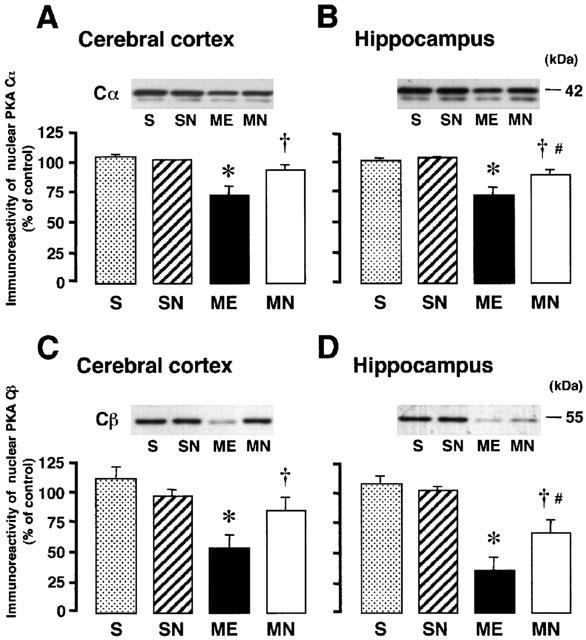
Representative Western immunoblots of nuclear PKA subunits (Cα and Cβ) in the upper panels indicate the specific 42-kDa band for Cα in the right parietal cortex (A) and hippocampus (B), and the 55-kDa band for Cβ in the parietal cortex (C) and hippocampus (D) from the right hemisphere of the nefiracetam-untreated (ME) and nefiracetam-treated (MN) rats with ME, and from that of the nefiracetam-untreated (S) and nefiracetam-treated (SN) sham-operated rats on day 3 after the operation. Quantified data for the levels of Cα and Cβ proteins in the right parietal cortex and hippocampus are shown in the lower panels. Each value represents the mean percentage of the control±s.e.mean of eight animals. *Significantly different from the sham-operated group (P<0.05). †Significantly different from the corresponding untreated ME group (P<0.05). #Significantly different from the nefiracetam-treated sham-operated (SN) group (P<0.05).
