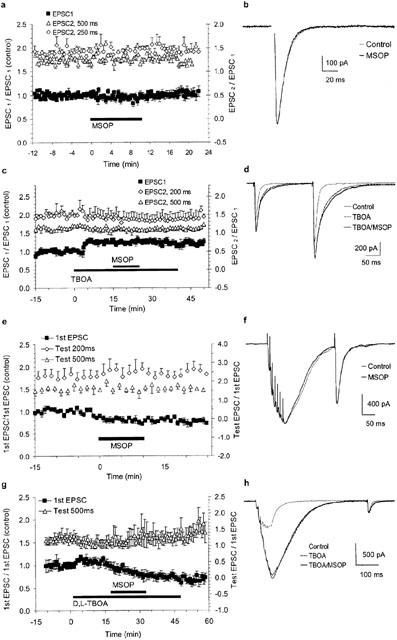
Figure 4.

Paired-pulse and tetanic stimulations did not activate group III mGluRs. (a) Group data for seven experiments using paired-pulse stimulation (latencies 250 ms in four cells and 500 ms in three cells). Closed symbols are EPSC1 amplitudes relative to the pretreatment phase (left-hand y-axis). Open symbols correspond to facilitation of EPSC2 vs. EPSC1 (right-hand y-axis). (b) Superimposed EPSC1 averages (seven traces) show that single EPSCs were not affected in the presence of MSOP (stimulus artefact blanked). (c) Group data for three experiments using stimulation protocols similar to (a) but with application of D,L-TBOA prior to MSOP. Note the increase in EPSC1 amplitude without change in facilitation of EPSC2 after D,L-TBOA. (d) Superimposed averages of six paired-pulse traces under control conditions and after addition of TBOA and TBOA/MSOP. (e) Group data for six experiments using tetanic bursts followed by single test pulses. Closed symbols are the amplitude of the 1st EPSC of the burst relative to pretreatment phase (left-hand y-axis). Open symbols show the potentiation of testpulses with 200 and 500 ms latency (right-hand y-axis). (f) Averages of four traces in control and MSOP conditions show that the post-tetanic potentiation of a test pulse elicited 200 ms after burst stimulation was not different. A scaling factor of 1.1 was applied to the trace in MSOP to compensate for the run-down in 1st EPSC amplitudes. (g) Group data of five experiments using tetanic bursts as in (e) and applying D,L-TBOA prior to MSOP. (h) Superimposed averages of six traces under the indicated conditions (stimulations artefacts deleted and traces in TBOA and TBOA/MSOP scaled by 1.5 and 1.8, respectively, to compensate for the run-down in 1st EPSC amplitudes.
