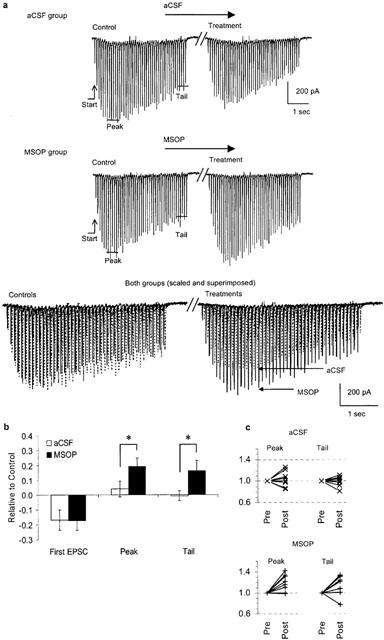
Figure 5.

MSOP reveals endogenous activation of group III mGluRs during EPSC trains. (a) Trains (10 Hz, 4.5 s) were characterized by their ‘Start' EPSC amplitude and the mean amplitude of five EPSCs during ‘Peak' and ‘Tail'. The upper example illustrates sham-treatment with aCSF, the middle example is from a neurone treated with 1 mM MSOP. Both pre- and post-treatment trains are shown below, superimposed and scaled to their respective ‘Start' values (the time resolution is enhanced and aCSF trains in dashed lines are shifted slightly along the time axis to facilitate visual comparison). The time gap between control and treatment represents 12 min. (b) Group data for all three post-treatment train parameters for aCSF- and MSOP-groups (eight cells per group). The difference in the treatment factor (aCSF/MSOP) was significant: P<0.05; two-way ANOVA. (c) All individual data pairs for relative ‘Peak' and ‘Tail' values during pre- and post-treatment.
