
Figure 5.
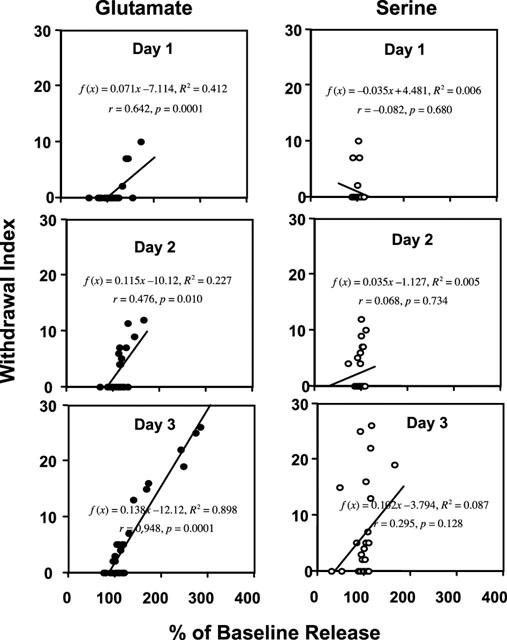
Figure shows the regression and correlation (r) between changes in the release of glutamate and serine following the daily injection and withdrawal scores in rats from the four experimental treatment groups (see text for further detail).
Official websites use .gov
A
.gov website belongs to an official
government organization in the United States.
Secure .gov websites use HTTPS
A lock (
) or https:// means you've safely
connected to the .gov website. Share sensitive
information only on official, secure websites.
Figure shows the regression and correlation (r) between changes in the release of glutamate and serine following the daily injection and withdrawal scores in rats from the four experimental treatment groups (see text for further detail).