
Figure 3.
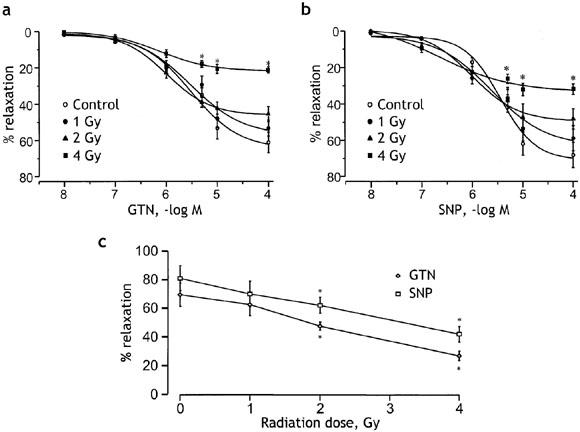
Effects of different doses of radiation on the concentration–response curves for GTN (a) and SNP (b). The relaxant responses obtained in control preparations are compared with those in preparations at the 7th day after irradiation with doses of 1, 2 or 4 Gy. The responses are expressed as per cent relaxation of phenylephrine-induced contraction. Points are means and vertical lines s.e.mean of 17 preparations from five animals in each case. (c) Radiation dose response curves showing a dose-dependent reduction in the maximum relaxation response to GTN (10 μM, diamonds) and SNP (10 μM, squares) measured at 9 days after irradiation. Experiments were performed on 18 aortic rings from six control animals and 15 rings from five animals in each of the other groups receiving 1, 2 or 4 Gy radiation. *P<0.05 vs the respective control values.